
Bitcoin Price Bounces, But Bears Are Still in Control
Bitcoin price jumped 4.78% to $69,128 on March 9 but technical signals — EMA death cross, descending triangle — show bears still hold the wheel.
What to Know
- $69,128 — Bitcoin's price on March 9, up 4.78% intraday with a high of $69,497
- The Crypto Fear and Greed Index has sat in fear territory for most of 2026, reflecting persistent bearish sentiment
- Bears need Bitcoin to close above $73,000–$75,000 on volume before any trend reversal is credible
- Prediction market odds sit at 57% on further downside toward $55,000, versus a bull target of $84,000
Bitcoin price staged a sharp intraday recovery on March 9, climbing to $69,128 — a 4.78% gain that had some traders calling a bottom. Don't buy it yet. The macro backdrop is a mess: the VIX surged past 35, oil briefly flirted with $120 per barrel, and equities sold off hard after U.S. and Israeli strikes on Iran rattled global markets. Against that, Bitcoin's single-session bounce looks less like a reversal and more like a reflex.
What Is the Bitcoin Price Chart Actually Saying?
Why this bounce doesn't change the bigger picture
The session opened at $65,974. By afternoon, Bitcoin price had pushed up to $69,128 with a high tick at $69,497. On the surface, a 4.78% move is the kind of day retail traders screenshot. But zoom out one week and the story gets uglier fast.
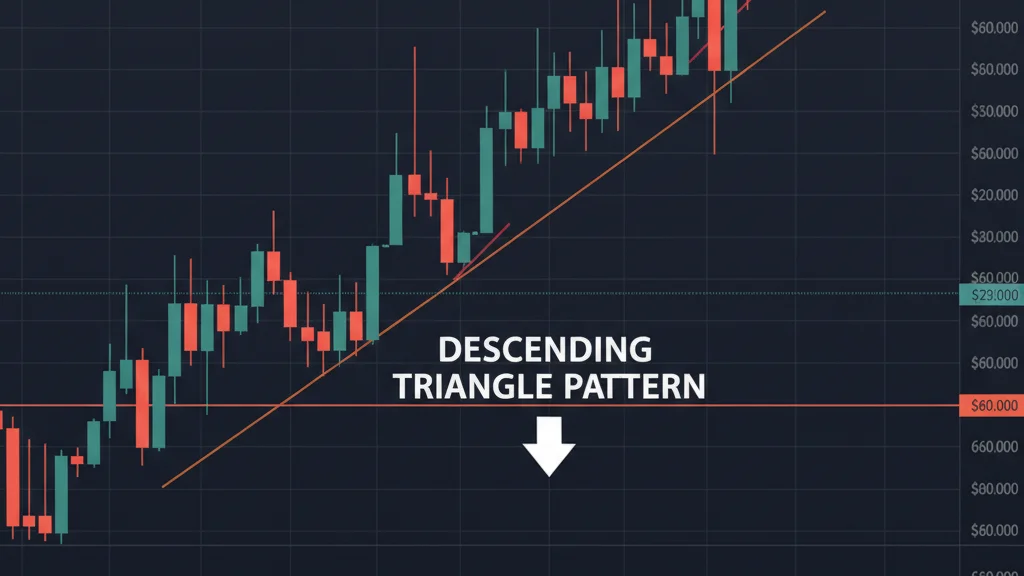
Last week, Bitcoin appeared to crack above the descending triangle that has been compressing price since February. It didn't hold. The weekly candle closed back inside the triangle — what looked like a breakout turned out to be a wick. Technically, that prints as something close to an inverted doji: no body, big wicks on both ends, meaning sellers absorbed every buyer who showed up and sent price back down. The triangle ate the breakout. Today traders are probing that same resistance again.
Until Bitcoin actually escapes the triangle and holds above it, the ADX shift is a yellow light, not a green one.
Three Indicators, One Message: Bears Haven't Left
The Average Directional Index — ADX — sits at 33.7. That's technically in 'strong trend' territory since anything above 25 confirms a trend is in play, but the read here is more nuanced. The ADX during this bear run peaked higher and is now receding. A declining ADX doesn't mean bulls have taken over; it means the prevailing trend is losing steam. That's a different thing entirely. Call it a yellow light if you're generous.
The RSI reads 49.3 — almost exactly at the neutral midpoint of 50. Below 30 is oversold, above 70 is overbought, and right now Bitcoin is parked in no man's land. Traders typically want to see RSI break and hold above 50 before claiming any real momentum shift. At 49.3, there's no conviction in either direction.
The EMAs tell the cleanest story. The 50-day EMA sits below the 200-day EMA — a setup most technicians call a death cross — and the gap between them is widening, not closing. EMAs weight recent price action more heavily, so when the short-term average trails the long-term one, it means recent price behavior has been consistently weaker than the broader trend. That's not a technicality. That's the structure of a bear market still intact.
Does the Macro Backdrop Help or Hurt Bitcoin?
Traditional markets gave no comfort on March 9. The VIX — Wall Street's volatility gauge — surged above 35, its highest reading in nearly a year. Oil briefly spiked toward $120 per barrel following military strikes in the Middle East. Stocks fell. Gold fell. The usual safe havens didn't act like safe havens.
Almost every top-10 crypto asset opened in the green — Tron being the lone exception — which on paper looks like crypto decoupling from equities. But that framing is optimistic. The Crypto Fear and Greed Index has been stuck in the fear zone for most of 2026, and Bitcoin's own volatility index, the BVIV, already spiked above 96 in early February when BTC touched $60,000. A single green day doesn't override months of fearful positioning.
What happens with equity futures this week matters more than today's intraday move. If stocks keep selling off and the VIX stays elevated, risk assets — including Bitcoin — face real ceiling pressure regardless of any short-term reflex bounce. Equity futures will act as either a floor or a lid for how far this move actually carries.
Where Does Bitcoin Need to Go for Bulls to Win?
Here's the number that matters: $73,000–$75,000. That's where the descending trendline runs, and also close to where the 50-day EMA sits at $73,293. For bulls to actually change the character of this market, Bitcoin needs multiple daily closes above that zone on real volume — not wicks, not intraday spikes that get faded.
A rising ADX alongside those closes would confirm the move has genuine trend strength. Without that, every bounce inside this compression zone is just noise. Prediction market data shows traders pricing a 57% probability of further downside toward $55,000, with the remaining 43% on a rally to $84,000. That's not exactly a ringing bull endorsement.
The downside scenario is equally clean. Lose the $65,000–$66,000 volume shelf — the price level where most recent trading has been concentrated — and the path toward $60,000 opens quickly. The Bitcoin Volatility Index already showed what that zone looks like when sellers take control. Today's 4.78% pop gives intraday traders a trade. Swing traders and holders are still inside a bearish structure.
What Should Traders Watch This Week?
Equity futures are the leading indicator here, not Bitcoin's own chart. If the S&P 500 stabilizes and the VIX retreats from 35, risk appetite returns and Bitcoin has room to probe resistance. If equities keep rolling over, the intraday bounce on March 9 is just a dead cat.
The descending triangle has defined Bitcoin's price structure for weeks. It has already swallowed one attempted breakout. A second failed attempt at the same resistance — especially against a backdrop of elevated macro volatility and bearish technical structure — would be a meaningful confirmation that sellers are still firmly in charge.
The bounce was real. The trend hasn't changed.