Bitcoin Price Today: BTC Up 30% From February Lows, Is $100K Next?
Bitcoin rally from February lows puts BTC near $80,000 resistance as of April 24. Analyst warns the crowd is bullish at the wrong moment again.

What to Know
- Bitcoin has climbed more than 30% from its February lows and is pressing toward $80,000, with sentiment flipping sharply bullish
- The resistance zone between $80,000 and $109,000 was flagged months ago, and the specific target band being watched is $81,750 to $94,330
- The analyst's last buy was on February 6 near $63,500, and he sees no reason to chase current prices
- Key supports sit at $74,968 to $77,250, with channel support at $76,400 and a deeper cushion between $67,500 and $72,900
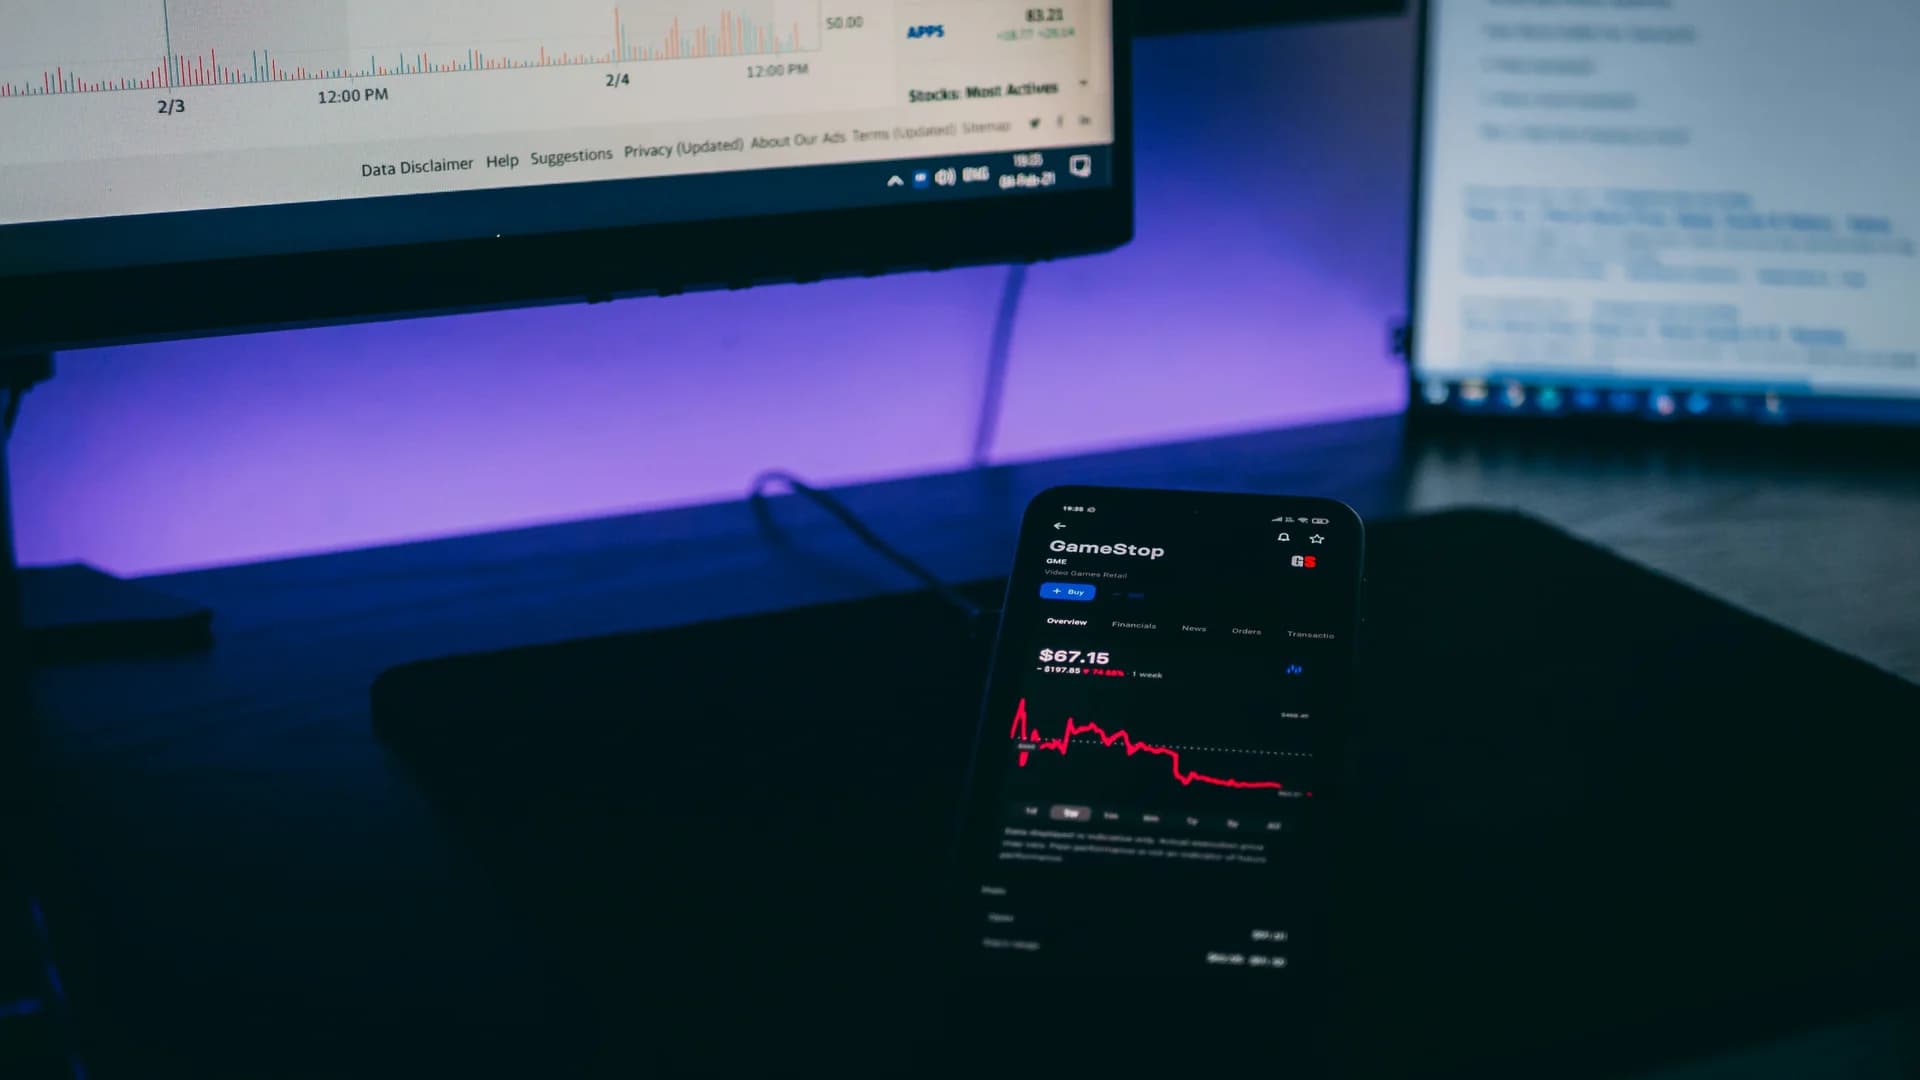
The Bitcoin rally from February lows has now delivered a 30% move higher, and the crowd that was screaming crash two months ago is suddenly looking at $100,000 like it's a given. That shift, more than the price itself, is the part worth paying attention to. BTC is pressing into the $80,000 area that traders have been circling on charts since the start of the year. The rally is real. Whether the enthusiasm showing up at the top of that range is warranted is a different question.
Why the $80,000 Zone Is the Story, Not the Rally
Hitting resistance is not a crash signal. It is what resistance zones exist for. The band between $80,000 and $109,000 was mapped out months before price ever got close, and the Bitcoin $80000 resistance is behaving exactly as structural analysis predicted it would. The specific target range in play right now is $81,750 to $94,330. Price has not fully tagged it yet, which leaves room for more upside in the short term.
That last point matters. Nothing about hitting resistance forces an immediate rejection. What changes the read is the shape of what happens next. A clean thrust into the target band followed by a sharp, structured decline is the setup that would signal the next leg down is starting. Until that happens, the rally has the benefit of the doubt.
People go bearish at the lows and bullish at resistance. It's the same pattern, over and over.
The Trap Traders Keep Walking Into
Here is the uncomfortable part. When Bitcoin was printing lows in February, most traders on Twitter were loudly calling for a full-blown capitulation. The same accounts have now pivoted to $100K targets and moonshot charts. The analyst tracking this structure says he has watched this movie more times than he can count.
The advice is not to short the rally. Shorting inside a 30% uptrend is a fast way to get stopped out twice. The advice is to stop chasing. Buying into euphoria at the top of a well-defined resistance zone has historically been a terrible risk-to-reward trade, and the current setup looks uncomfortably similar to the previous ones.
Call it the curse of being right early. The people who bought the lows are the same ones now fielding questions about why they aren't adding at $78,000. The answer: because the levels that made February obvious are the same levels that make late April complicated.
When Does the Analyst Actually Buy?
The two setups that would trigger a new entry
The last confirmed purchase was on February 6 at roughly $63,500, which anchors the Bitcoin rally from February lows that everyone is now celebrating. Current prices do not trigger another buy. Two conditions would.
The first is a clean advance followed by a pullback to a higher low. That is textbook trend continuation, and it requires patience to wait for rather than imagination to invent. The second is a daily RSI oversold reading. The Bitcoin RSI oversold signal preceded both the November and February rallies that each ran 20% to 30% higher, so it is a tested trigger, not a vibes-based one.
- Resistance: $78,324 to $79,260 (immediate ceiling)
- First support: $74,968 to $77,250
- Channel support: $76,400
- Deeper support: $67,500 to $72,900 if selling accelerates
- Upper target band: $81,750 to $94,330
What This Means for the $100,000 Question
Short answer: $100,000 is not impossible, but it is not the base case from here without a detour first. The upper resistance band extends to $109,000, which means a push into six figures would arrive inside the same zone analysts have been warning about. A tag and reject there is a different scenario than a clean breakout with volume confirmation on a daily close.
The bigger picture has not actually changed in months. The levels that mattered in February are the same levels that matter now. What changed is the crowd reading them. If you have been holding since the lows, nothing in the current setup forces a decision. If you are eyeing a fresh entry, patience is likely the highest-yielding asset in the portfolio right now.
That is an unsexy take in a week where everyone wants to talk about the next leg up. It is also the take that tends to age best.
How Should Investors Read the Current Setup?
Answer first: expect more volatility in the $78,000 to $82,000 band before any decisive move. The resistance zone is doing exactly what a resistance zone does, which is absorb buy pressure and test conviction. Short-term traders should expect whipsaws. Longer-term holders should not be making emotional decisions at this level in either direction.
Two things are true at once. Higher prices are still possible in the short term. And the probability of a structured pullback somewhere inside the $81,750 to $94,330 target band remains high. Holding both ideas at the same time is the uncomfortable but correct read. The market does not owe anyone a clean answer on which comes first.
Frequently Asked Questions
How much has Bitcoin rallied from its February lows?
Bitcoin has climbed more than 30% from its February lows. The analyst's last documented buy was on February 6 near $63,500, and BTC is now pressing into the $80,000 zone in late April 2026. The rally has been sharp enough to flip retail sentiment from bearish to euphoric.
What is the key Bitcoin resistance zone to watch?
The major resistance band sits between $80,000 and $109,000, with the specific target range analysts are watching at $81,750 to $94,330. Immediate resistance is $78,324 to $79,260. A clean daily close above the upper band is what would confirm a trend shift rather than a rejection.
Is Bitcoin going to hit $100,000 next?
$100,000 is inside the broader resistance zone that extends to $109,000, so it is technically possible, but it is not the base case without a pullback first. Most historical rallies into this kind of multi-month resistance produce a retest before a clean breakout, which is why the analyst is not chasing current prices.
What signal triggers the analyst's next Bitcoin buy?
Two setups would trigger a new purchase: a clean advance followed by a pullback to a higher low, or a daily RSI oversold reading. The RSI oversold signal preceded both the November and February rallies that ran 20% to 30% higher, which is why it functions as a tested trigger rather than a guess.